R has increased. Time to panic?
You may have recently seen in the news that R0 (the reproduction rate) in the U.K. has increased. This is concerning and we should all keep a close eye on the overall R value. However, it is wholly possible that R0 as dropped all over the country, but for the average value to appear flat, or even increase because of something known as Simpson’s Paradox.
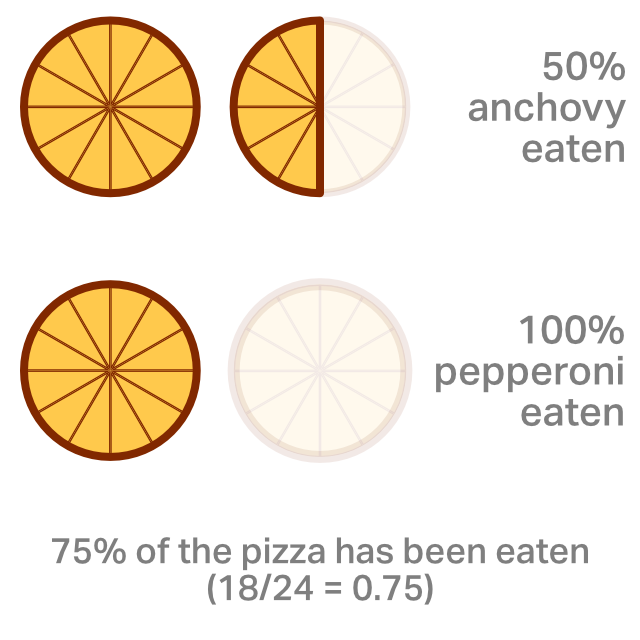
Imagine we have 2 large 12-slice pizzas. One is anchovy, the other is pepperoni. Pepperoni is more popular, and the rate of pizza consumption is 100% (Rpizza = 1). Anchovy is less popular, and the rate of consumption is only 50%! Out of 24 slices in total, 18 have been consumed. This represents an overall rate of pizza consumption of 75%.

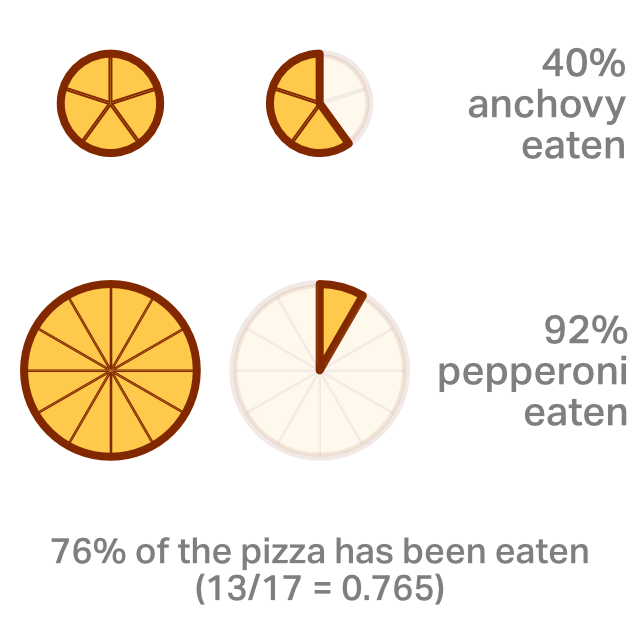
Now, because of a wide-scale weight loss program, everyone decides to eat less pizza. The anchovy pizza now only has 5 slices, but we have the same amount of pepperoni.
In the below example, only 11 slices of pepperoni have been eaten, and 2 slices of anchovy. We can rejoice, the rate of pizza consumption has gone down across the board! Only 92% of the pepperoni, and 40% of the anchovy pizza has been eaten! The overall picture tells a different tale. In total 13 slices of pizza were eaten out of 17 slices available in total. That works out to 76.5%! The percentage of the pizzas being consumed has gone up, even though: a) Less pizza is being consumed in total, b) Both pizzas have a lower percentage being eaten.

This has happened because the pizza with the lower Rpizza is no longer as represented in the overall figures. The same could be true for England’s R value. It could well be the case that transmission everywhere has reduced, but because the reduction in the normal community was so much more the R value is shifting to become a representation of transmission in hospitals and care homes. If the recent estimations of around 25 new infections in London per day prove to be accurate then this could well be the case.